|
|
||
|---|---|---|
| .. | ||
| README.md | ||
| example-signals.png | ||
| example-signals.xcf | ||
| see-timeseries-annotated.png | ||
| see-timeseries-annotated.xcf | ||
| see-timeseries-example.png | ||
| see.py | ||
README.md
I see what you did there
Category: Ground Segment Points (final): 146 points Solves: 23
Your rival seems has been tracking satellites with a hobbiest antenna, and it's causing a lot of noise on my ground lines. Help me figure out what he's tracking so I can see what she's tracking
Given files: rbs_m2-juliet20230hotel.tar.bz2, examples.zip
Write-up
by erin (barzamin).
In this challenge, we're sneakily observing two PWM-based motor drivers on an antenna mount drive; the duty cycle of each is proportional to the angle of the alt/az axis it's controlling. We'd like to figure out what that duty cycle is at any given instant, so we can reconstruct where it's pointing; if we have that data, over time, we can compare it to a list of satellite traces and figure out what it was pointing at. However, we don't have the direct drive waveform; we have a timestamped recording of the RF noise each axis is generating. Sidechannel analysis time!
We're given a list of possible satellites with Two-Line Elements for each, and an examples zip with example sidechannel recordings and the satellites we belong to. I didn't actually automate interaction with the server, so I just did (echo 'THE_TICKET') | nc antenna.satellitesabove.me 5034 and grabbed the relvant information (location and observation start time/length) to paste into my code.
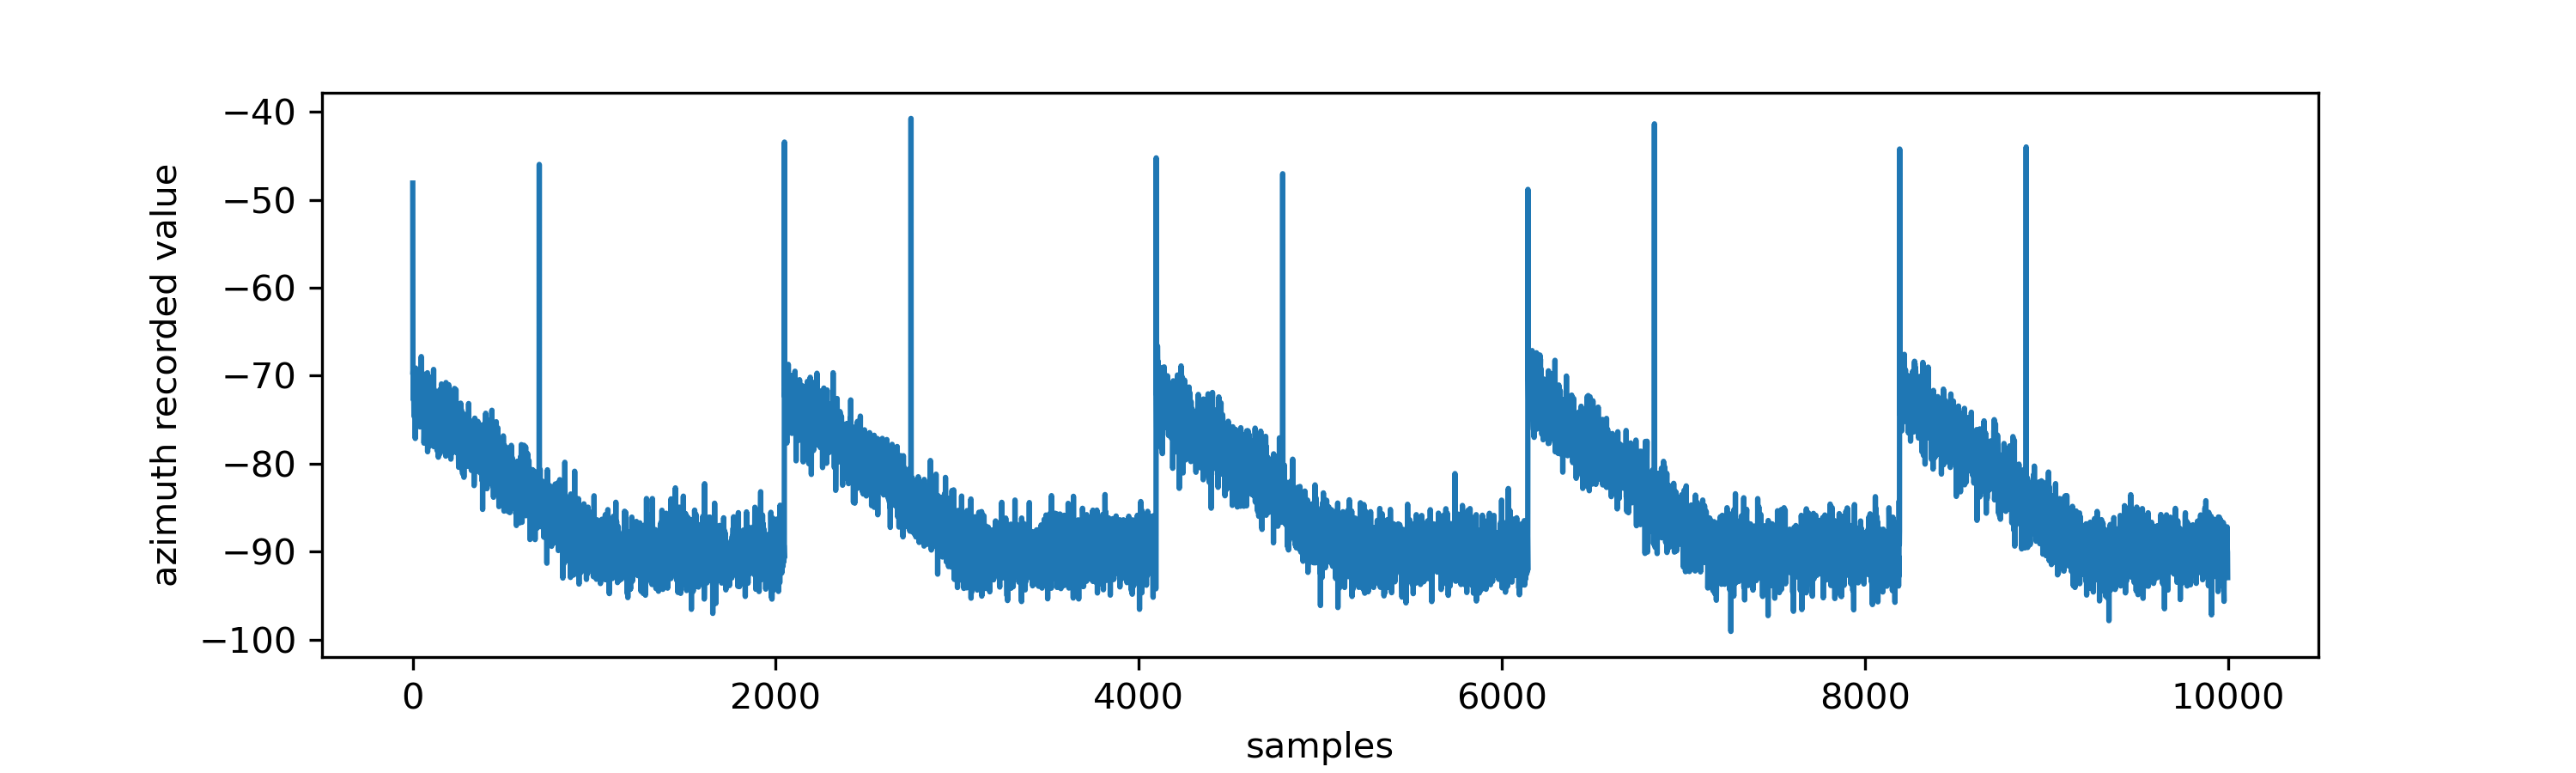
Looking at one of the sample captures (CANX-7 azimuth), we see a fairly distinctive periodic pattern of peaks rising out of noise:
I guessed these were transients when the drive signal flipped state, inferring that the drive signal would look something like this:
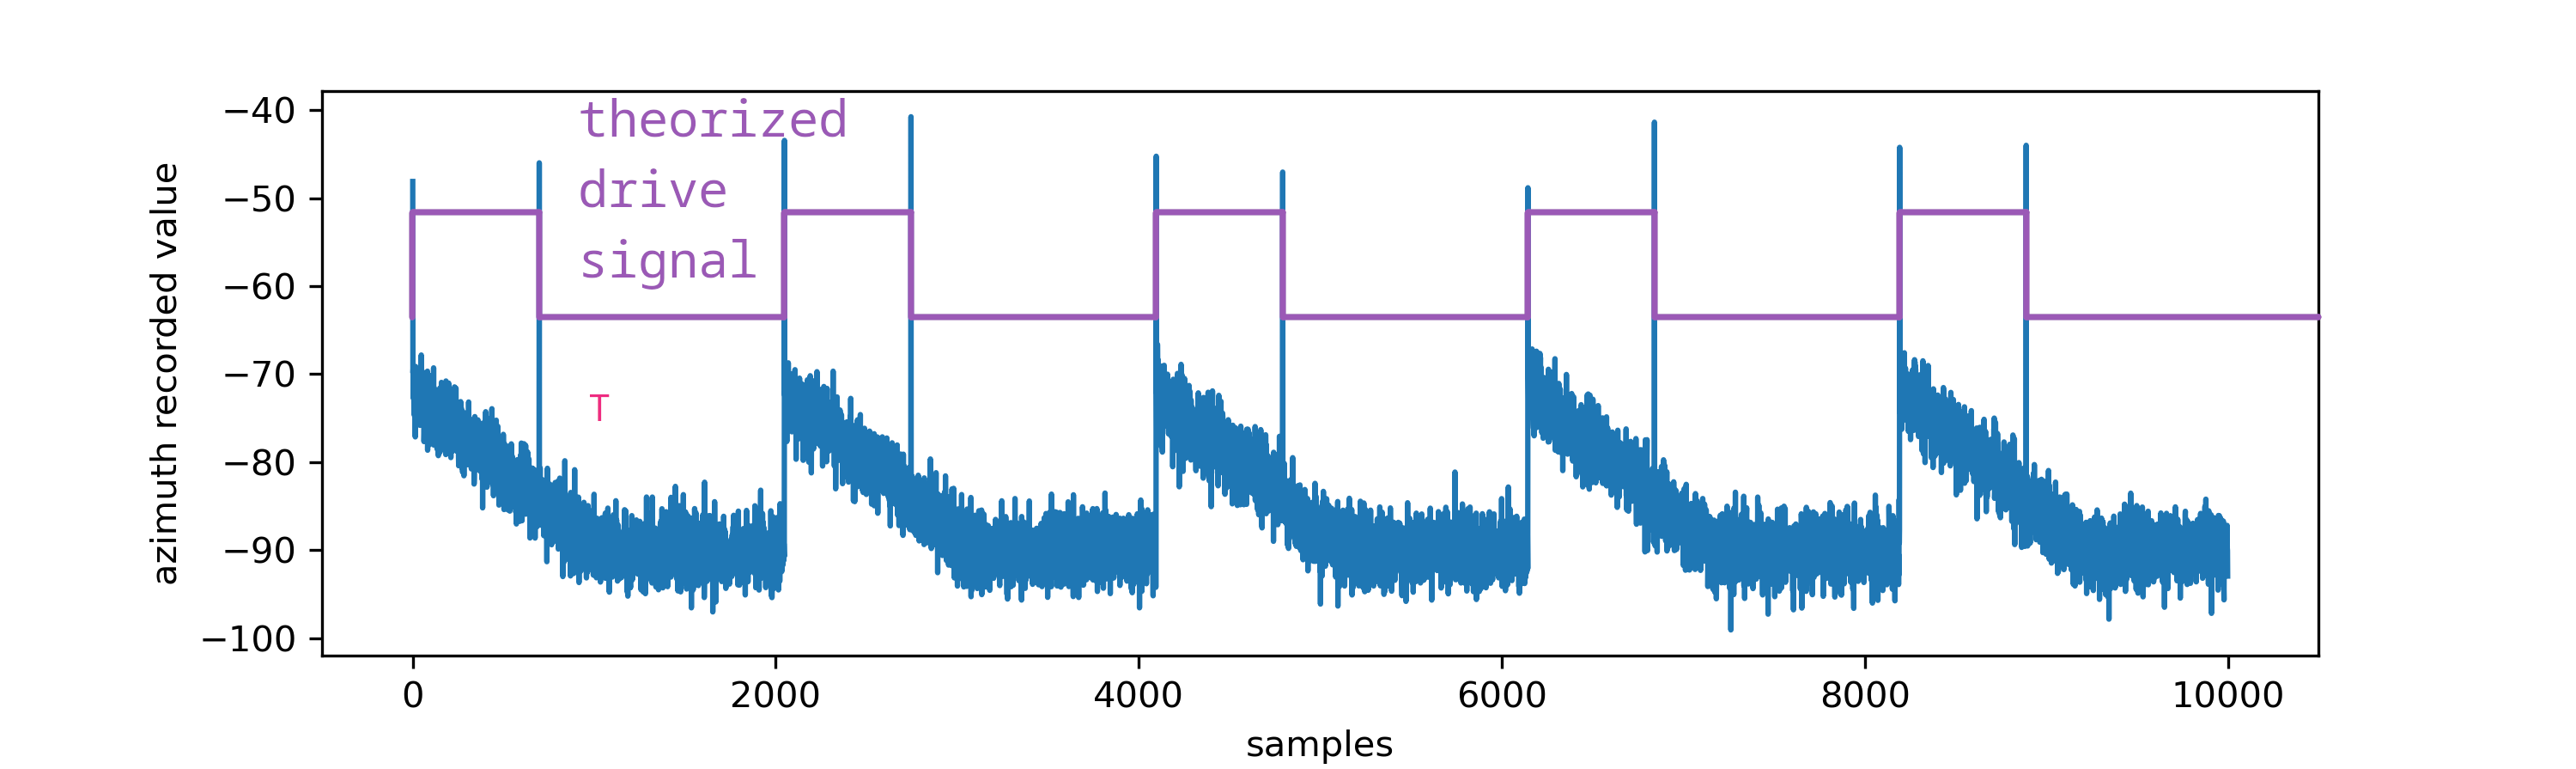
By identifying these peaks in the time-series signal, we can compute the drive period and duty cycle by measuring the distances between peaks. I performed peak detection with scipy.signal.find_peaks(); the distance between every first and second peak is measured to get the high time, while the distance between the first peak and third peak is used to extract the drive frequency (which is constant over the whole signal, because it's pulse width modulation):
def compute_duty_cycle(x):
    peaks, props = signal.find_peaks(x, prominence=20)
    peaks = np.concatenate(([0], peaks))
    T_high = peaks[1::2] - peaks[::2]
    T_motor_drive = peaks[2]-peaks[0]
    return T_high/T_motor_drive, T_motor_drive
Using this code, I computed the duty cycles for all examples, and also predicted the ideal duty cycles from the tracker (cf Track That Sat). They match, quantitatively, very well (I also checked L2 distance or something similar but I don't remember what it was other than it being on the order of ~1e-6).
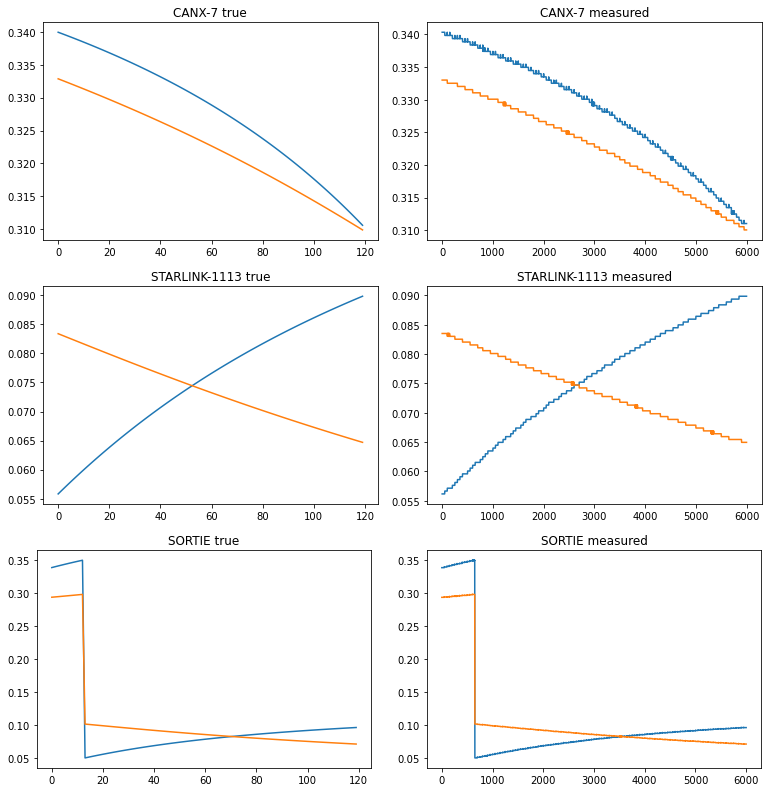 {width=90%}
Now that we know we can compute duty cycle over time from the sidechannel signal, we need to figure out how to search for a satellite that could be tracked at a given time. We have a list of all possible candidate satellites, so we can just figure out which ones are above the horizon and precompute the alt/az duty cycles over the timeframe we're given using Skyfield:
satellites = load.tle_file('../tts/examples/active.txt')
by_name = {sat.name: sat for sat in satellites}
visible = []
for sat in tqdm(satellites):
    alt, az, _ = (sat-station).at(time(60)).altaz()
    if alt.degrees > 0:
        visible.append(sat)

station = Topos(37.5, 15.08)

ts = load.timescale()
def time(dt):
    return ts.utc(datetime.fromtimestamp(1585993950.588545+dt,tz=utc))

def compute_true_trajectory(sat, loc, times):
    orients = []
    for dt in times:
        t = time(dt)
        diff = sat - loc
        topocentric = diff.at(t)
        alt, az, dist = topocentric.altaz()
        orients.append([az, alt])
    return orients

def map_angle(angle):
    return 0.05 + angle.degrees * (0.35-0.05)/(180)

def azalt_to_duty(az, alt):
    if az.degrees > 180:
        return [map_angle(Angle(degrees=az.degrees%180)), map_angle(Angle(degrees=180-alt.degrees))]
    else:
        return [map_angle(az), map_angle(alt)]

duty_traces = []
for sat in tqdm(visible):
    duty_traces.append([azalt_to_duty(*o)
                  for o in compute_true_trajectory(sat, station, times)])
dtraces = [np.array(x) for x in duty_traces]
Then for each of the unknown signals, we can just find the satellite with trace closest to the ones measured (minimize error in az + error in alt between guess and query to match):
for X in [X0, X1, X2]:
    measured_az, drive_period_az = compute_duty_cycle(X[:,1])
    measured_alt, drive_period_alt = compute_duty_cycle(X[:,2])

    errors = np.array([np.linalg.norm(measured_az[::60]-trace[:-1,0])
        + np.linalg.norm(measured_alt[::60]-trace[:-1,1])
        for trace in dtraces])

    print(np.argmin(errors), visible[np.argmin(errors)])
This gives a printout which looks something like
64 EarthSatellite 'APRIZESAT 2' number=28366 epoch=2020-04-10T06:04:32Z
384 EarthSatellite 'ELYSIUM STAR 2 & LFF' number=43760 epoch=2020-04-10T11:25:42Z
269 EarthSatellite 'LINGQIAO VIDEO B' number=40960 epoch=2020-04-10T10:20:29Z
From there, just copypasta and grab flag.
Full code